1 min read
As a sales director you’ve probably come across two major problems when analyzing sales manager reports. You have either almost no data to work with (and that that’s available is sketchy at best) or a report filled with just about every pie chart and bar graph known to man.
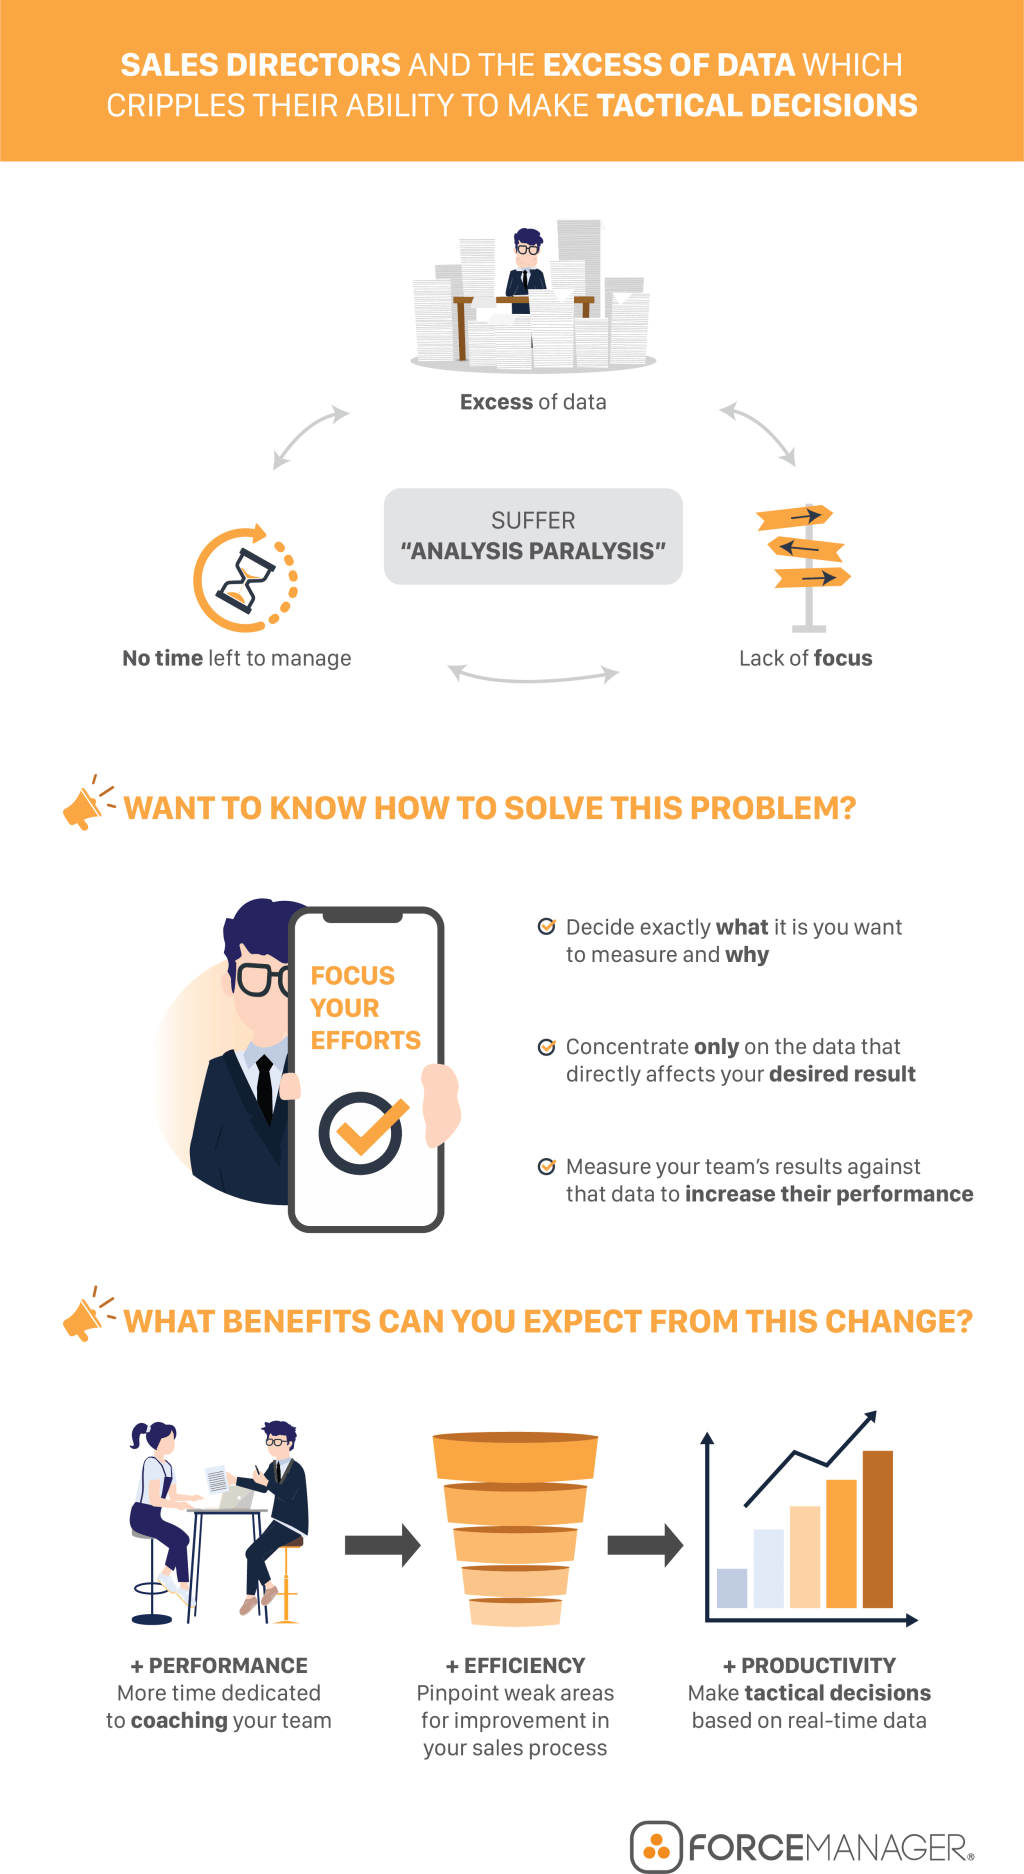
This data overload causes directors to not lose time not only in its collection, but in analyzing, deciphering and trying to extract insights that can boost the performance of their sales team.

As the infographic points out, what’s needed above all else is focus. Field sales directors need to first figure out what it is they want to measure and why.
For example, if your objective is to increase revenue from new business, you need to think about which objectives and activities you wish your team to undertake (more prospecting calls, more face-to-face visits, number of “cold” leads contacted) that directly affect this result.
This way you avoid the famous “analysis paralysis” when trying extract insights from data that has no direct connection with your business objectives.
With mobile sales tools and artificial intelligence technology available to field sales teams it’s now easy to build a weekly sales report around the data you need. It allows you to pinpoint the problem areas in your sales reps’ activity, afford you time to coach through their weaknesses and increase your team’s overall performance.
What’s more, you will no longer:
Want to enjoy the benefits of concise, accurate sales reporting?